Tableau Project
Preparing for Influenza Season
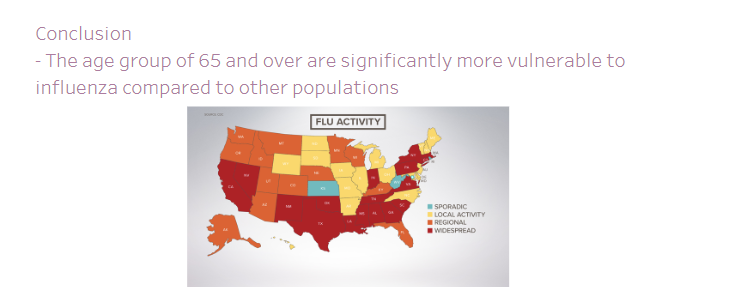
The United States has an influenza season where more people than usual suffer from the flu. Some people, particularly those in vulnerable populations, develop serious complications and end up in the hospital. Hospitals and clinics need additional staff to adequately treat these extra patients. The medical staffing agency provides this temporary staff.
Objective
Determine staffing, when to send staff, the number of staff needed and to which state.
Goal
Using storytelling create a report in Tableau telling the analytical story.
Dataset and Context
As part of a course in data analytics at Career Foundry, I worked on this project using Datasets from the CDC and the US Census Bureau as the source. 1. Influenza deaths by geography, time, age, and gender Source: CDC 2. Population data by geography Source: US Census Bureau 3. Counts of influenza laboratory test results by state (survey) Source: CDC (Fluview)
Third Step- Insights and Data Visualization
As opposed to what the company was expecting, sales across the main regions (North America, European Union, and Japan) have not remained the same. Overall, the industry’s sales have been declining since year 2009. It is important to bear in mind that the data is biased towards retail sales and does not accurately capture the market of software sales, which in turn could depict a different behavior.
Steps for Data Preparation and Data Analysis:
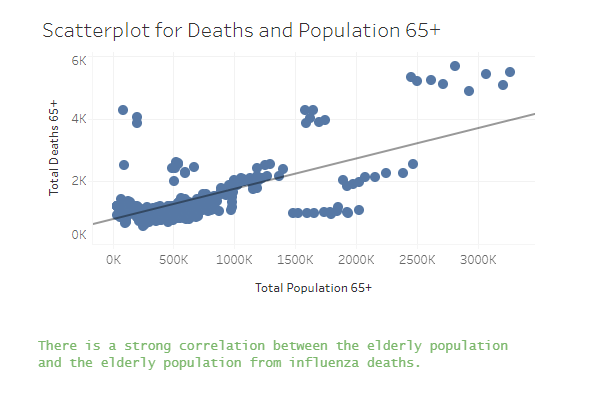
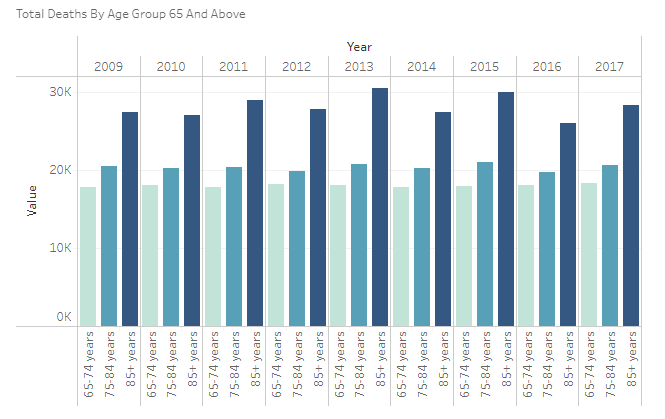
In order to begin analysis, I started by outlining the possible bias from each of the datasets. Then worked through Data Profiling and data cleaning, running quality and integrity checks on the data. Thirdly, I worked through the Data Integration and transformation. This helped to formulate a hypothesis test to compare and identify if there were significant differences regarding certain groups. After formulating a hypothesis, I was able to begin calculating the variance and standard deviation for key variables. Lastly, within the data set I was able to identify variables with a potential relationship and test for a correlation. Example, The correlation between deaths and population over 85+.
Final Recommendations
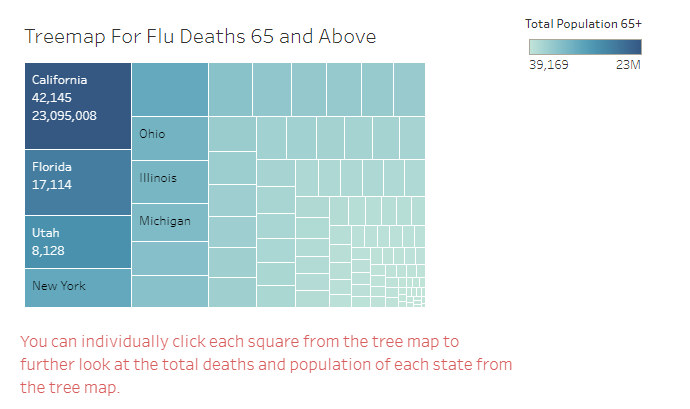
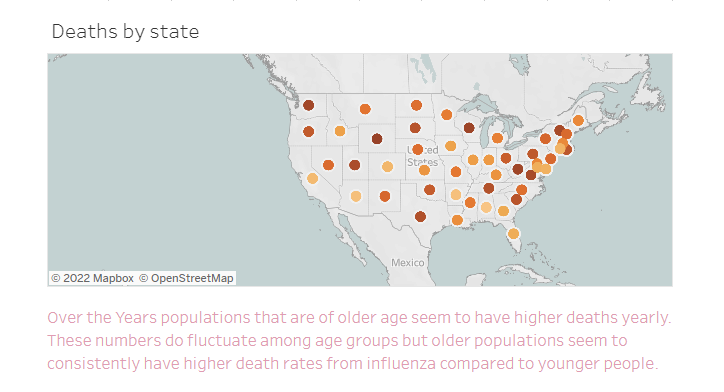
Staff should be sent to states with the highest mortality rates and the most patients over the age of 65. Influenza vaccinations should be readily available to the full population.
